Where am I?
We’re at Week 6 of the 52 Ancestors in 52 weeks challenge. And this week we’re talking Maps.
I’m a visual person and need pictures, sketches, photos and maps to keep me interested, so I use maps a lot in my research. I use them to compare the same places at different times and I use them to see how a town or village has changed with the addition of a railway, a canal, a main road or a motorway. Here are just a few of my favourite websites for different types of maps. I hope you find them useful.
National Library of Scotland
The National Library of Scotland Maps site is a treasure-trove of maps and plans. Don’t be fooled by the title, this site includes maps for the whole of Great Britain, including Ordnance Survey maps, Town Plans and Estate maps and a beautiful 1846 Ordnance Map of Hong Kong.

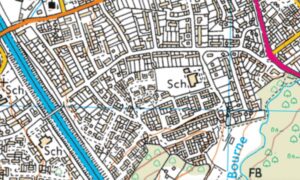
This snippet is a map of Addlestone in 1895 – a place I am very familiar with. Addlestone was a small hamlet of its larger neighbour, Chertsey, Surrey but it bears no resemblance to the location today.
Using a succession of ordnance survey maps, it was clear the biggest change in the area occurred in the 1970s and 1980s when a lot of social housing was built on what was once open fields and orchards; illustrated by the second map. The increase in house building was followed by the opening of M25 which split Addlestone and Rowtown in two.
Charles Booth Poverty Maps
The Charles Booth Poverty Maps are my absolute favourite maps. They are particularly useful to those of us whose ancestors lived in London in the late 19th century and early 20th century. The maps cover an area West to East from Hammersmith to Greenwich and from South to North from Clapham to Hampstead. They were produced as part of an enquiry into the level of poverty in London with each street colour coded by social class from Black (lowest class) to Yellow (upper class).
The publication by Charles Booth “Labour and life of the people” described not only the housing but some of the inhabitants of the streets. It is a tough read and could be quite upsetting, especially if you discover your ancestors lived in a place such as St Hubert Street:
St Hubert Street, was an area classified as housing people of “Lowest class. Vicious, semi-criminal.” Two descriptions included:

Hawker (female) ……… 1 room ……. 3 school children …………..

“Husband in prison – mother lives with them – doubtful characters.)

Hawker ……………………. 1 room ……. 1 child at school ……………..

(Two elder sons loaf about)
Overall the street was described as “an awful place. . . the worst street in the district. The children are rarely brought up to any kind of work, but loaf about and no doubt form the nucleus for future generations of thieves and other bad characters. . . . “
It is well worth viewing the police notebooks that accompany the maps. These notebooks, like Boot’s publication, both give very ‘honest’ reports of some of the areas, using language that wouldn’t be acceptable today.
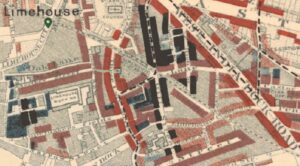
Some of my own ancestors came from the Limehouse area of London and it’s possible to see, from the snippet below, that the area is mixed. There are some very poor areas in the backstreets but people living on the main thoroughfares tended to live in better conditions.
Tithe Maps
The payment of Tithes originated before the Norman Conquest and was a payment in kind of a tenth of farm produce (crops, fruits, dairy produce), to support the local priest.
As times changed, this became very cumbersome. So the Tithe Commutation Act 1836 established a procedure where Tithes were converted to money payments. To do this fairly, accurate maps were drawn up showing all the land in a parish. Along with the maps was a document showing the owners, occupiers and a description of the land, a house, a barn, a cottage and what the land was used for, i.e. a garden, a park or arable land. Most of this work was carried out before the 1841 and 1851 censuses were taken. This makes Tithe maps particularly helpful when used alongside the records of those two censuses, especially as the 1841 census is often quite vague when it comes to place names. The Genealogist has an amazing collection of Tithe Maps.
Tithe maps also help to picture the environment in which your ancestor lived. A Tithe Map of 1845 and the written apportionment shows my ancestor, George Whale living in a cottage with a garden belonging to Richard Landsley. I imagine George and his wife Caroline starting their married life in a little cottage in the middle of the village.

Maps
If you are considering publishing your family history I would highly recommend the use of maps to illustrate your findings. They are a fabulous way of bringing your family history to life by seeing where your ancestors lived. Did they live in a rural community with farms and small cottages or did they live in slums in the East End of London?
I have spent a number of very fulfilling hours noting down addresses of my ancestors from various different records, then plotting the locations on different maps. It’s great fun and a fabulous learning experience.
——————————————————————
Charles Booth – Labour and life of the people, 1840-1916 – https://archive.org/details/labourlifeofpeop01bootuoft/page/n9/mode/2up
Charles Booth Poverty maps – https://booth.lse.ac.uk/map/16/-0.0327/51.5112/93/0?marker=536620,180978
National Library of Scotland maps – https://maps.nls.uk/
The Genealogist – https://www.thegenealogist.co.uk/